


Key Insights
Pipeline coverage ratios serve as the most reliable predictor of quota attainment. B2B teams typically need 3-4x pipeline coverage to consistently hit revenue targets, though this varies by industry and sales cycle complexity. Tracking this metric alongside stage-by-stage conversion rates reveals not just whether you have enough opportunities, but where deals systematically stall—enabling targeted process improvements that directly impact close rates and revenue predictability.
Response speed dramatically influences conversion outcomes, with leads contacted within five minutes converting 21 times more effectively than those reached after 30 minutes. Automated communication systems that capture, qualify, and route inquiries immediately—while logging every interaction in your CRM—eliminate the manual burden that causes delays. This integration ensures activity metrics remain accurate while your team maintains the velocity needed to capitalize on high-intent prospects.
Role-specific dashboard views prevent information overload while ensuring each stakeholder gets actionable intelligence. Sales reps need personal performance tracking and next-action priorities, managers require team-wide visibility for coaching decisions, and executives benefit from strategic summaries with exception-based alerts. Layered dashboards with drill-down capabilities balance simplicity for daily use with comprehensive analysis when investigating specific issues or trends.
Integrating communication data with traditional CRM metrics reveals the qualitative factors behind quantitative outcomes. When every call, text, email, and chat automatically feeds into your reporting infrastructure, you can correlate engagement patterns with win rates—identifying which channels, response times, and outreach frequencies actually drive deals forward. This complete picture enables coaching that addresses both activity volume and effectiveness, creating sustainable performance improvements across your entire revenue organization.
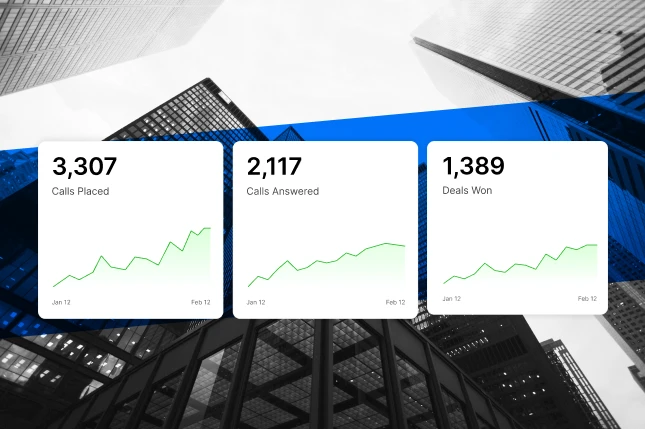
A sales performance dashboard transforms scattered data into clear, actionable insights that help you understand what's driving revenue—and what's holding it back. Instead of hunting through spreadsheets or toggling between multiple tools, you get a unified view of pipeline health, rep activity, conversion rates, and forecast accuracy. This visibility enables faster decisions, smarter coaching, and more predictable growth across your entire go-to-market motion.
What Is a Sales Performance Dashboard?
A sales performance dashboard is a visual reporting tool that consolidates key metrics from your CRM, communication platforms, and other systems into a single, real-time view. It shows how effectively your team converts opportunities into revenue by tracking both leading indicators (like call volume and email outreach) and lagging indicators (such as win rates and closed deals).
Unlike static reports that capture a moment in time, these dashboards update continuously as new data flows in. This means sales managers can spot bottlenecks early, identify which reps need support, and adjust strategies before issues compound. The result is a more responsive, data-driven approach to managing your sales organization.
Modern dashboards also integrate communication data—including call logs, text messages, and email activity—so you can see how outreach patterns influence deal progression. When your AI Agent OS automatically logs every customer interaction across voice, text, email, and chat, that information feeds directly into your dashboard, giving you a complete picture of engagement without manual data entry.
Why These Tools Matter for Revenue Teams
Revenue leaders face constant pressure to hit targets while managing team performance, forecasting accurately, and allocating resources efficiently. Without centralized visibility, it's easy to miss early warning signs—like a stalled pipeline stage or declining activity levels—until they impact the quarter.
Dashboards eliminate guesswork by surfacing the metrics that matter most. Sales managers can quickly assess whether their team has enough pipeline coverage to hit quota, identify which deals need immediate attention, and understand which behaviors correlate with closed business. This clarity supports better coaching conversations, more accurate forecasts, and faster course corrections.
For remote and hybrid teams, shared visibility becomes even more critical. When everyone can see the same real-time data, alignment improves, accountability increases, and collaboration becomes more focused. Reps know exactly where they stand against goals, and managers can prioritize their time based on actual performance gaps rather than assumptions.
Real-Time Data Drives Faster Decisions
Speed matters in sales. The faster you can identify a problem—whether it's a rep falling behind on activity, a deal aging without progress, or a sudden drop in conversion rates—the faster you can intervene. Real-time dashboards make this possible by updating as soon as new information enters your systems.
This immediacy helps sales leaders respond proactively rather than reactively. If a high-value opportunity hasn't been touched in a week, the dashboard flags it. If a rep's call volume drops below target, you see it immediately. These early signals enable timely coaching, resource reallocation, and strategic adjustments that keep revenue on track.
Unified Metrics Improve Team Alignment
When different teams use different reports, confusion and misalignment follow. Marketing might measure success by lead volume while sales focuses on qualified opportunities, creating friction around what's actually working. A well-designed dashboard establishes a single source of truth that everyone references.
This shared visibility ensures that sales, marketing, and operations teams speak the same language. Everyone tracks the same definitions for qualified leads, pipeline stages, and conversion rates. Meetings become more productive because you're debating strategy, not data accuracy. Decisions gain buy-in because they're grounded in metrics everyone trusts.
Essential Metrics to Track
Not all metrics deserve space on your dashboard. The most effective ones balance input activities (what reps control) with output results (what the business needs). Together, these indicators reveal both current performance and future trajectory.
Pipeline Health Indicators
Pipeline coverage ratio shows whether you have enough opportunities to hit your revenue target. Calculate it by dividing total pipeline value by your quota. Most B2B teams need 3-4x coverage to consistently hit goals, though this varies by industry and sales cycle length.
Stage-by-stage conversion rates reveal where deals get stuck. If opportunities move smoothly from discovery to demo but stall at proposal, you know where to focus coaching and process improvements. Tracking deal age by stage helps identify which opportunities need immediate attention versus which are progressing normally.
Deal velocity measures how quickly opportunities move through your funnel. Faster velocity means more predictable revenue and better resource utilization. When velocity slows, investigate whether it's a rep skill issue, a product-market fit problem, or a process bottleneck.
Activity and Productivity Metrics
Call volume, email outreach, and meeting bookings represent the input activities that fuel pipeline growth. While activity alone doesn't guarantee results, consistent effort typically correlates with better outcomes. Tracking these metrics helps ensure reps maintain momentum and follow proven processes.
Response time matters significantly in sales. Leads contacted within five minutes are 21 times more likely to convert than those reached after 30 minutes. Your dashboard should highlight average response times so managers can coach reps on speed and prioritization.
When your AI Agent OS handles inbound calls, texts, and chats automatically, it logs every interaction in your CRM without requiring manual entry. This ensures your activity metrics stay accurate and complete, even when reps are juggling multiple conversations. The system can also qualify leads, schedule follow-ups, and route urgent inquiries to the right person—all while updating your dashboard in real time.
Revenue and Efficiency Metrics
Win rate shows what percentage of qualified opportunities close successfully. Low win rates suggest problems with lead quality, sales skills, or competitive positioning. Tracking this metric by rep, product line, and lead source helps identify specific improvement areas.
Average deal size and sales cycle length reveal efficiency patterns. If certain reps consistently close larger deals or move opportunities faster, study their approach and share those techniques across the team. If deal sizes are shrinking or cycles are lengthening, investigate whether market conditions, competition, or internal processes have changed.
Quota attainment at both individual and team levels provides the ultimate measure of success. However, it's most useful when paired with leading indicators. A rep who's behind on quota but ramping up activity and building pipeline may be on track to catch up, while someone hitting quota with a declining pipeline could face trouble next quarter.
Forecasting and Predictive Metrics
Forecast accuracy measures how well your predictions match actual results. Consistent accuracy builds confidence with leadership and helps with resource planning. When forecasts miss regularly, examine whether the problem stems from poor data hygiene, overly optimistic reps, or inadequate pipeline coverage.
Deal slippage rate tracks opportunities that push to future periods. Some slippage is normal, but excessive delays often indicate qualification issues, unrealistic timelines, or insufficient buyer engagement. Monitoring this metric helps sales managers identify which deals need intervention and which forecasting assumptions need adjustment.
Types of Dashboards for Different Roles
Different stakeholders need different views of the same underlying data. A sales rep cares about their personal quota and next actions, while a VP of Sales needs to understand team-wide trends and resource allocation. Building role-specific dashboards ensures everyone gets relevant information without overwhelming noise.
Individual Rep Dashboard
Sales reps need a personal command center that shows their progress toward quota, upcoming tasks, and deal priorities. This view should highlight their pipeline by stage, recent activity levels compared to targets, and which opportunities need immediate attention based on age, size, or engagement level.
A well-designed rep dashboard also surfaces coaching insights. If a seller's win rate lags behind team averages or their sales cycle is lengthening, they should see these trends with context about what good looks like. This visibility helps reps self-correct and prioritize skill development without waiting for formal reviews.
Sales Manager Dashboard
Managers need visibility across their entire team to identify who's excelling, who needs support, and where process improvements would have the biggest impact. Their dashboard should compare individual performance against team averages and targets, highlight at-risk deals, and show activity trends that predict future results.
This view also helps prioritize coaching time. If one rep has strong activity but poor conversion rates, they might need technique refinement. If another has great win rates but insufficient pipeline, they need help with prospecting. The dashboard makes these patterns obvious so managers can intervene strategically rather than guessing.
Executive Leadership Dashboard
Senior leaders need strategic visibility without getting lost in operational details. Their dashboard should focus on high-level metrics like total pipeline value, forecast versus quota, year-over-year growth trends, and win rates by segment or product line.
Executives also benefit from exception-based reporting—automatic alerts when key metrics deviate from expectations. If pipeline coverage drops below healthy levels or win rates decline suddenly, leadership needs to know immediately so they can allocate resources or adjust strategy. This proactive approach prevents small issues from becoming quarter-ending problems.
Pipeline and Activity-Specific Views
Specialized dashboards dive deep into specific aspects of the sales process. A pipeline health dashboard might show deal distribution across stages, conversion rates between stages, and aging analysis to identify stalled opportunities. An activity dashboard tracks calls, emails, meetings, and demos to ensure reps maintain consistent outreach.
These focused views complement broader dashboards by providing detailed context when leaders need to investigate specific issues. They're particularly useful during pipeline reviews, where sales managers and reps discuss individual deals and develop action plans to move them forward.
Building an Effective Dashboard
Creating a dashboard that people actually use requires thoughtful planning. Start by identifying your audience and their primary questions. What decisions do they need to make? What information would help them act faster or smarter? These answers should guide your metric selection and layout design.
Define Clear Objectives First
Before choosing metrics or designing layouts, clarify what you're trying to achieve. Are you improving forecast accuracy? Increasing rep productivity? Identifying coaching opportunities? Your objectives determine which data points matter most and how they should be organized.
Involve stakeholders in this planning phase. Sales managers, reps, and operations teams all have valuable perspectives on which metrics drive behavior and where current reporting falls short. This collaborative approach increases adoption because people feel ownership over the final product.
Ensure Data Quality and Integration
Your dashboard is only as reliable as the data feeding it. Start by auditing your CRM hygiene—are opportunity stages defined consistently? Do reps update deal information promptly? Are closed dates accurate? Poor data quality undermines trust and leads to bad decisions.
Integration architecture matters too. The best dashboards pull from multiple sources—CRM, marketing automation, communication platforms, and customer success tools—to provide complete context. When your AI Agent OS logs every call, text, email, and chat interaction automatically, that communication data enriches your CRM records without requiring manual entry. This integration ensures your activity metrics stay accurate and your engagement insights remain current.
Design for Clarity and Action
Visual design significantly impacts dashboard effectiveness. Apply the five-second rule: can someone understand the key message within five seconds? Use color purposefully—green for on-track metrics, red for urgent issues, yellow for warning signs. Avoid clutter by limiting each view to 5-7 key metrics rather than cramming in every available data point.
Choose appropriate chart types for each metric. Line graphs work well for trends over time, bar charts compare categories effectively, and gauges show progress toward goals at a glance. Make sure your dashboards work on mobile devices, since many sales managers review performance during commutes or between meetings.
Enable Drill-Down and Filtering
High-level summaries provide context, but users often need to investigate specific details. Build drill-down capabilities so managers can click on a metric to see underlying data—like which specific deals contribute to pipeline coverage or which reps are behind on activity targets.
Filtering options add flexibility without creating separate dashboards for every scenario. Users should be able to view metrics by time period, team, product line, region, or other relevant dimensions. This self-service approach reduces requests to your analytics team and empowers users to answer their own questions.
Common Implementation Mistakes
Dashboard overload ranks among the most common failures. Organizations build too many dashboards with overlapping metrics, creating confusion about which view to trust. Start with one or two core dashboards and expand only when clear needs emerge.
Vanity metrics waste space and attention. Tracking total leads generated feels productive but doesn't help if most are unqualified. Focus on metrics that connect directly to revenue outcomes and influence decision-making. If a metric doesn't prompt action, remove it.
Static dashboards without automated refresh quickly become outdated and irrelevant. Ensure your data updates frequently enough to support real-time decision-making—ideally continuously or at least several times per day. When information is stale, users stop checking and revert to manual reporting.
Advanced Strategies for Maximum Impact
Once your basic dashboard infrastructure is working, consider advanced techniques that provide deeper insights and predictive capabilities.
Incorporate AI and Predictive Analytics
Machine learning models can score deals based on historical patterns, predicting which opportunities are most likely to close and which need intervention. These predictions help sales managers prioritize coaching time and guide reps toward high-probability deals.
Anomaly detection automatically flags unusual patterns—like a sudden drop in activity or an unexpected spike in deal slippage. Instead of manually scanning reports for problems, the system alerts you when something requires attention. This proactive approach prevents small issues from becoming major setbacks.
Unify Communication and CRM Data
Traditional dashboards show what happened in your CRM but miss the why behind those outcomes. Integrating communication data—calls, texts, emails, and chat transcripts—provides crucial context about buyer engagement and rep effectiveness.
Our AI Agent OS captures every customer interaction across all channels and automatically logs it in your CRM. This means your dashboard can show not just that a deal progressed, but also how many touchpoints occurred, which communication channels were most effective, and whether response times met best practices. You get a complete picture of engagement without relying on manual activity logging.
This integration also improves lead response metrics. When an inbound call or text arrives, our system can qualify the lead, answer common questions, schedule appointments, and route urgent matters to the appropriate rep—all while updating your CRM and dashboard in real time. This automation ensures no opportunity falls through the cracks while maintaining accurate activity tracking.
Implement Gamification Elements
Leaderboards and achievement tracking can boost motivation when implemented thoughtfully. Public recognition for top performers encourages healthy competition, while progress bars showing quota attainment give reps clear visibility into their standing.
However, gamification works best when balanced with collaboration. Celebrate team wins alongside individual achievements, and ensure your metrics reward quality outcomes (like win rates and deal sizes) rather than just activity volume. The goal is to inspire performance improvement without creating toxic competition.
Mobile-First Design Considerations
Sales managers and reps increasingly access dashboards from phones and tablets. Mobile views should prioritize the most critical metrics and use larger touch targets for filtering and drill-down actions. Push notifications can alert users to urgent situations—like a high-value deal going stale or a rep falling significantly behind on activity.
Simplified mobile dashboards that focus on 2-3 key metrics per screen work better than cramming desktop layouts onto small screens. Consider creating mobile-specific views that highlight daily priorities and next actions rather than comprehensive analytics.
Driving Adoption and Continuous Improvement
Building a great dashboard is only half the battle. Getting your team to actually use it requires change management, training, and ongoing optimization.
Secure Leadership Buy-In
Executive sponsorship dramatically increases dashboard adoption. When senior leaders reference specific metrics in meetings, ask questions based on dashboard data, and hold teams accountable for the numbers shown, everyone else takes notice. Make sure your leadership team understands the dashboard's value and actively promotes its use.
Demonstrate ROI early by highlighting specific wins enabled by dashboard insights—like identifying a at-risk deal that was saved through timely intervention, or spotting a successful rep's technique that was then replicated across the team. These concrete examples build credibility and momentum.
Provide Role-Specific Training
Different users need different training approaches. Sales reps benefit from quick tutorials showing how to check their personal metrics and identify their next priorities. Managers need deeper training on analyzing team performance, identifying coaching opportunities, and using filters to investigate specific issues.
Create reference documentation that explains how each metric is calculated, why it matters, and what actions users should take based on different scenarios. This context helps people understand not just what the numbers mean, but how to use them effectively.
Establish Regular Review Routines
Dashboards become most valuable when integrated into existing workflows. Start weekly team meetings by reviewing key metrics together. Have managers conduct one-on-ones with reps using their personal dashboards as the foundation for discussion. Make monthly pipeline reviews data-driven by building them around dashboard insights.
These routines reinforce the dashboard's importance and help identify areas where additional metrics or different visualizations would add value. As your team becomes more data-literate, they'll naturally suggest improvements based on their daily experience.
Measure Dashboard ROI
Track adoption metrics like login frequency, time spent in dashboards, and which views get used most often. High engagement indicates you're providing value, while low usage suggests problems with relevance, usability, or training.
More importantly, monitor business outcomes. Has forecast accuracy improved? Are deals moving through the pipeline faster? Have win rates increased? These results demonstrate whether your dashboard investment is paying off and justify continued development.
Maintain and Optimize Over Time
Your dashboard should evolve as your business changes. Conduct quarterly reviews to assess whether current metrics still align with strategic priorities. Retire outdated or unused metrics, add new ones that address emerging needs, and refine visualizations based on user feedback.
Data quality maintenance requires ongoing attention. Implement validation rules in your CRM to prevent bad data from entering the system. Provide regular reminders about data hygiene best practices. Consider appointing dashboard champions who monitor quality and help colleagues use the tools effectively.
Overcoming Common Challenges
Even well-designed dashboards face obstacles. Understanding common challenges helps you address them proactively.
Addressing Data Quality Issues
Incomplete or inaccurate CRM data undermines dashboard reliability. Sales reps often skip data entry when they're busy, leading to gaps in activity tracking and deal information. Combat this through a combination of automation, simplified processes, and accountability.
Automation reduces manual entry burden significantly. When your AI Agent OS logs every call, text, email, and chat automatically, reps don't need to remember to update activity records. When the system can schedule follow-ups and update deal stages based on conversation outcomes, data stays current without extra work.
For remaining manual processes, make them as simple as possible. Use dropdown menus instead of free text, set required fields strategically, and integrate data entry into existing workflows rather than treating it as a separate task. Regular data hygiene audits help identify and correct systemic issues before they spread.
Combating Low Adoption Rates
If your team isn't using the dashboard consistently, investigate why. Common causes include poor usability, irrelevant metrics, lack of training, or insufficient leadership support. User interviews and usage analytics help pinpoint specific problems.
Sometimes low adoption reflects deeper cultural issues. If your organization doesn't value data-driven decision-making, a dashboard won't magically change that. Focus on demonstrating quick wins, celebrating teams that use data effectively, and gradually building a more analytical culture.
Managing Technical Integration Complexity
Connecting multiple data sources can be technically challenging, especially when systems use different data formats or update schedules. Work with your IT or operations team to design robust integration architecture that handles errors gracefully and maintains data consistency.
Consider using integration platforms or middleware that simplify connections between systems. Many modern tools offer pre-built connectors for popular CRMs, marketing automation platforms, and communication systems. Our platform integrates seamlessly with major CRM and calendar systems, ensuring communication data flows automatically without custom development.
Balancing Simplicity with Comprehensiveness
There's tension between showing enough information to support decisions and avoiding overwhelming users with too many metrics. Resolve this by creating layered dashboards—high-level summaries for quick checks, with drill-down capabilities for detailed investigation.
Different roles need different levels of detail. Executives want strategic summaries, managers need team-level analysis, and reps require personal performance tracking. Building role-specific views ensures everyone gets appropriate information without unnecessary complexity.
Future Trends in Sales Analytics
Dashboard technology continues evolving rapidly. Understanding emerging trends helps you plan for future capabilities and competitive advantages.
AI-Powered Insights and Recommendations
Next-generation dashboards don't just display data—they interpret it and suggest actions. AI systems can automatically identify underperforming areas, recommend specific coaching interventions, and predict which opportunities need attention based on historical patterns.
Conversational interfaces allow users to ask questions in natural language rather than building complex filters. Instead of manually configuring a report to show "deals over $50K that haven't been updated in two weeks," you simply ask the system and get an immediate answer.
Voice-Activated Dashboard Interaction
Voice commands enable hands-free dashboard access, particularly useful for mobile users or during driving. Sales managers can check team performance, get deal updates, or receive forecast summaries through voice queries, making information accessible in more contexts.
This trend aligns naturally with AI-powered communication systems. When your phone system already uses voice AI to handle customer interactions, extending that capability to dashboard queries creates a seamless experience across your entire sales workflow.
Deeper Communication Analytics
Future dashboards will provide richer insights into communication effectiveness—not just whether a call happened, but what was discussed, how the prospect responded, and which talking points resonated. Conversation intelligence tools analyze call recordings to identify successful patterns and coaching opportunities.
This analysis extends across all channels. Text message response rates, email engagement metrics, and chat conversation quality all contribute to a comprehensive view of buyer engagement. When combined with deal progression data, these insights reveal which communication strategies actually drive revenue.
Embedded Dashboard Experiences
Rather than requiring users to log into a separate analytics tool, embedded dashboards appear directly in the applications people already use—like CRM interfaces, communication platforms, or collaboration tools. This contextual placement increases usage by meeting users where they already work.
Real-time alerts in communication channels (like Slack or Microsoft Teams) notify teams immediately when important metrics change or thresholds are crossed. This proactive approach ensures critical information reaches decision-makers without requiring them to constantly check dashboards.
Connecting Communication Data to Revenue Outcomes
The most sophisticated sales organizations understand that communication quality drives conversion rates. Every call, text, email, and chat represents an opportunity to move deals forward—or let them stall. Connecting this communication data to your dashboard provides unprecedented insight into what actually works.
Our AI Agent OS captures every customer interaction across all channels and automatically logs it in your CRM. This means your dashboard can show not just activity volume, but engagement quality. You can see which reps respond fastest to inbound inquiries, which communication channels generate the highest conversion rates, and how response times correlate with win rates.
The system also handles routine interactions automatically—qualifying leads, answering common questions, scheduling appointments, and following up on missed calls—while escalating complex situations to human reps. This automation ensures consistent, timely responses even when your team is busy, while maintaining complete activity records for dashboard reporting.
By integrating communication data with traditional CRM metrics, you get a complete picture of sales performance. You can identify which reps excel at phone conversations but struggle with email follow-up, or discover that text message reminders significantly reduce no-show rates for scheduled demos. These insights enable targeted coaching and process improvements that directly impact revenue.
Getting Started with Your Dashboard Strategy
Building an effective dashboard doesn't require starting from scratch. Begin with these practical steps:
First, audit your current reporting. What metrics do you track today? Which ones actually influence decisions? Where do gaps exist in your visibility? This assessment helps you prioritize what to build first.
Second, start simple. Choose 5-7 core metrics that matter most to your business—likely including pipeline coverage, win rate, sales cycle length, and activity levels. Build a basic dashboard around these metrics and ensure the data is accurate before expanding.
Third, focus on adoption. Train your team thoroughly, integrate dashboard reviews into existing meetings, and celebrate early wins. A simple dashboard that everyone uses beats a sophisticated one that sits ignored.
Fourth, iterate based on feedback. After a few weeks of usage, gather input from reps, managers, and executives about what's working and what's missing. Use these insights to refine metrics, improve visualizations, and add capabilities that address real needs.
Finally, automate data collection wherever possible. Manual entry creates burden and introduces errors. When your communication platform automatically logs every interaction, when your CRM updates deal stages based on rep actions, and when your dashboard refreshes continuously, your team can focus on selling instead of data maintenance.
Ready to connect your communication data with your CRM and build dashboards that actually drive revenue? Explore how our AI Agent OS automates lead capture, qualification, scheduling, and follow-up across voice, text, email, and chat—while keeping your dashboard metrics accurate and actionable.
Citations
- Lead response time statistic (21x more likely to convert within 5 minutes vs 30 minutes) confirmed by Harvard Business Review research and Lead Response Management Study, as reported by multiple sources including Voiso (2025) and LeadAngel (2025)
- Pipeline coverage ratio benchmark of 3-4x confirmed as standard industry practice by multiple sources including Bigtincan, Outreach (2025), Clari, and BoostUp (2025)